
With the 2012 presidential election now in the rearview mirror, the big question on everybody’s mind is, “Where do we go from here?” After an estimated $5.8 billion spent on presidential and congressional races, it is disappointing to many that the results produced no real changes to the existing power structure. While at first blush it’s easy to become more pessimistic about the direction of the economy and its influence on investment assets, one must recognize that money can be made (or lost) in most market environments. One of the keys to being successful is recognizing some of our own behavioral limitations and what effect they have on our decision making as we deploy investment capital. Two forces at play that can negatively impact investment decisions, and thereby investment performance, are sentiment and data bias.
Sentiment
“The Scream” by Edvard Munch courtesy of WebMuseum at ibiblio
Sentiment describes the opinions, emotions, or views of a group of people. In investing, sentiment, usually described by the emotions of optimism (Bullish) and pessimism (Bearish), can be a powerful determinant of security prices in the short run. The challenge with sentiment is that it is derived from emotions based largely upon what has already happened. History shows that more often than not – especially when positioned at bullish or bearish extremes based on investor sentiment – the market will go against the majority.
*Majority Party = Party with average of % control in House and % control in Senate greater than 50% (data provided by Ned Davis ResearchThe blue line represents the price level of the S&P 500 index since the end of 2007. The arrows represent market tops and bottoms during that period. The numbers next to the arrows represent the percentage of investors that were bullish, according to our sentiment models. Notice how most market tops happen when around three-fourths of the investors are bullish? Why is this? After strong market run-ups, the euphoria surrounding stock ownership has led investors to become fully invested in the market. Even if they are bullish about the future, limited additional resources remain available to invest, causing demand for stocks to slow. The same is true for bearish investors. If most investors have become bearish, those who were inclined to sell have already done so. It’s easy to see how errors of sentiment can be costly.
At the start of 2012, sentiment was still somewhat low. We had just witnessed political brinkmanship over the U.S. Treasury debt ceiling with an accompanying downgrade (from AAA) of the U.S. credit rating. The markets dropped -20% in a matter of weeks (July-Aug 2011). Short period swings of 4-5% (up or down) were not uncommon from August through October of 2011. During that time, our sentiment model hit a low of 38%. Investors were selling like crazy. Adding to their fears were the events in Europe, high unemployment, and the “fiscal cliff”. Yet, U.S. equity markets rose +25% from the sentiment low through September 2012 (while many investors missed out). Big money is made or lost during big moves, not by jumping in or out when the move is mostly over. Understanding sentiment, and its extremes, can improve your chances of being on the right the side of big moves. The brilliant quote from Warren Buffett, ” … try to be fearful when others are greedy and greedy only when others are fearful,” seems to aptly describe how to use sentiment to your advantage.
Data Bias
Data bias describes the act of validating data sources that support our opinion and invalidating those that do not. I’m reminded of a recent State Farm commercial in which a woman doubts the existence of a State Farm smartphone app. A man asks her, “Where did you hear that?” She replies, “The Internet … they can’t put anything that isn’t true on the Internet.” When asked where she heard that, she replies, “The Internet.” As funny as the commercial is, many of us allow our opinions to skew the selection of data we use to formulate our decisions. Nowhere is this clearer than in regards to one’s selection of news sources. If we validate only those sources that support our opinion, we can be led to make biased and non-rational decisions based on emotion. My experience is that the truth usually never lies in the extreme, but somewhere in the middle.
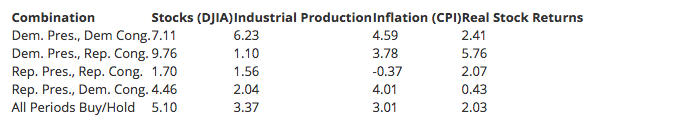
One such example is related to the recent outcome of the U.S. elections. While many may be disappointed with the “status quo” outcome of the election and the effect this might have on investment returns, historically (since 1900), the best combination for real stock returns has been with a Democratic President and a Republican congress (see data in the chart below). The worst combination has been the opposite; a Republican President with a Democratic controlled congress.
Percentage Gains for Stocks, Industrial Production, and Inflation
By Party of President and Majority Party* in Congress (03/04/1901 – 11/12/2012)
*Majority Party = Party with average of % control in House and % control in Senate greater than 50%
(data provided by Ned Davis Research)

Another interesting election related data point is that from Election Day to the end of the year, the DJIA has climbed a median of +1.9% when the incumbent party has won, versus losing -0.6% when the incumbent party has lost. Generally speaking, the occurrence of year-end rallies seems to be closely tied to the lifting of uncertainty that occurs once the election has been decided. Suffice it to say, that relying on biased news information can be hazardous to your investing health.
Looking Forward
So where does that leave us post-election? The markets have corrected -5% since the election and uncertainty has risen about the “fiscal cliff”, with its potential implications for a U.S. recession. These headwinds notwithstanding, there are some very interesting potential tailwinds developing as well.
First, our sentiment models have fallen into the excessive pessimism zone, a position from which stocks have typically produced double-digit gains. This has relieved the excessive bullish sentiment reached in mid-September. Also, much of the worst-case fiscal scenario has likely already been priced into stocks. We believe this sets the market up for a nice rally once signs of progress being made on the “fiscal cliff” begin to emerge.
Second, general economic conditions have been improving, albeit slowly. For example, real strength is now showing in the housing market. Home sales and prices are rising and are showing clear momentum to the upside (whereas housing – for the past 6 years – had been a headwind). The U.S. is also experiencing an energy boom, with the IEA forecasting the U.S. becoming the world’s largest producer of oil and gas over the next 5-7 years. This will provide major economic gains to America. U.S. manufacturing has been experiencing a recovery as well, partly helped by the relatively low cost of energy supplies found in the U.S., specifically natural gas. There are several companies spending billions of dollars to build U.S. manufacturing facilities, bringing some production back “on-shore”. There are even rumors of a Chinese manufacturing firm building a production facility in the U.S.
Time will tell whether these positive economic developments will be enough to offset any fiscal challenges next year. Based on our current economic models, we do not expect a recession in 2013. (One of our economic forecasting models even flashed an expansionary signal the week before the election).
At this juncture, the recent correction in equities hasn’t done any major damage to our market technical indicators. More than two-thirds of the world’s markets are still trending above their 200-day moving averages, while most markets, including the U.S., still have rising moving averages. Many of our models are neutral at worst, with none flashing bearish signals. In our view, the global cyclical uptrend remains intact and our current expectation is for the cyclical uptrend to reassert itself once the uncertainty surrounding the fiscal cliff improves.
– Greg Stewart, CIO


